

Using data from the U.S. Census Bureau, this fact sheet and interactive map detail health insurance coverage for Kansans in 2021 by congressional district and age group. The type of coverage available, demographic factors such as age and income, access to care and personal preference are some of the factors that may lead to differences in health insurance coverage between areas. These differences may indicate an opportunity for improvement. For example, if all congressional districts had the uninsured rate reported for children in the 3rd District (3.9 percent), there would be 8,700 fewer uninsured children in Kansas.
Insurance Coverage By Kansas Congressional District 2022
Key Points
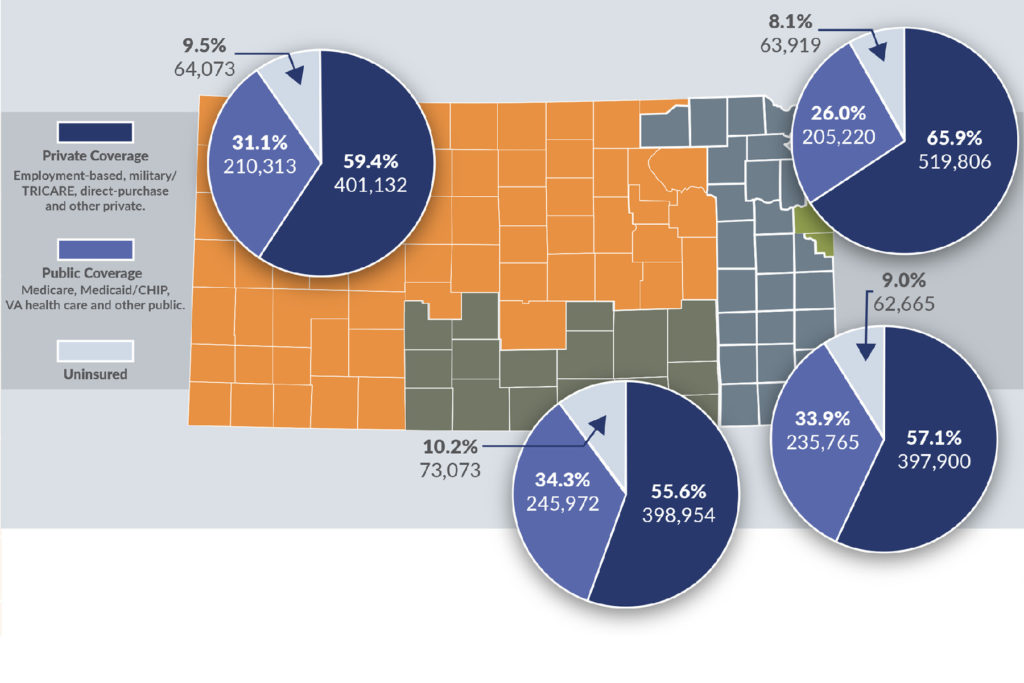
- In 2021, there were 263,730 uninsured Kansans representing 9.2 percent of the population. The uninsured rate varied from a high of 10.2 percent in the 4th Congressional District to a low of 8.1 percent in the 3rd District. The statewide uninsured rate has remained the same as 2019 (9.2 percent).
- There were 37,565 uninsured children in Kansas, a statewide rate of 5.0 percent. The 1st Congressional District (5.6 percent), the 2nd District (5.6 percent) and the 4th District (5.3 percent) exceeded the statewide rate.
- About one-quarter (26.0 percent) of the population in the 3rd District was covered by public insurance (including Medicare, Medicaid/CHIP, VA health care and other public) compared to more than 3 in 10 Kansans in the other districts (31.1 percent in the 1st District, 33.9 percent in the 2nd District and 34.3 percent in the 4th District).
- About 6 in 10 (59.7 percent) Kansans were covered by private coverage (employment-based, military/TRICARE, direct-purchase and other private) ranging from 55.6 percent in the 4th District to 65.9 percent in the 3rd District.
Explore the status of health insurance coverage across Kansas congressional districts in this interactive map.
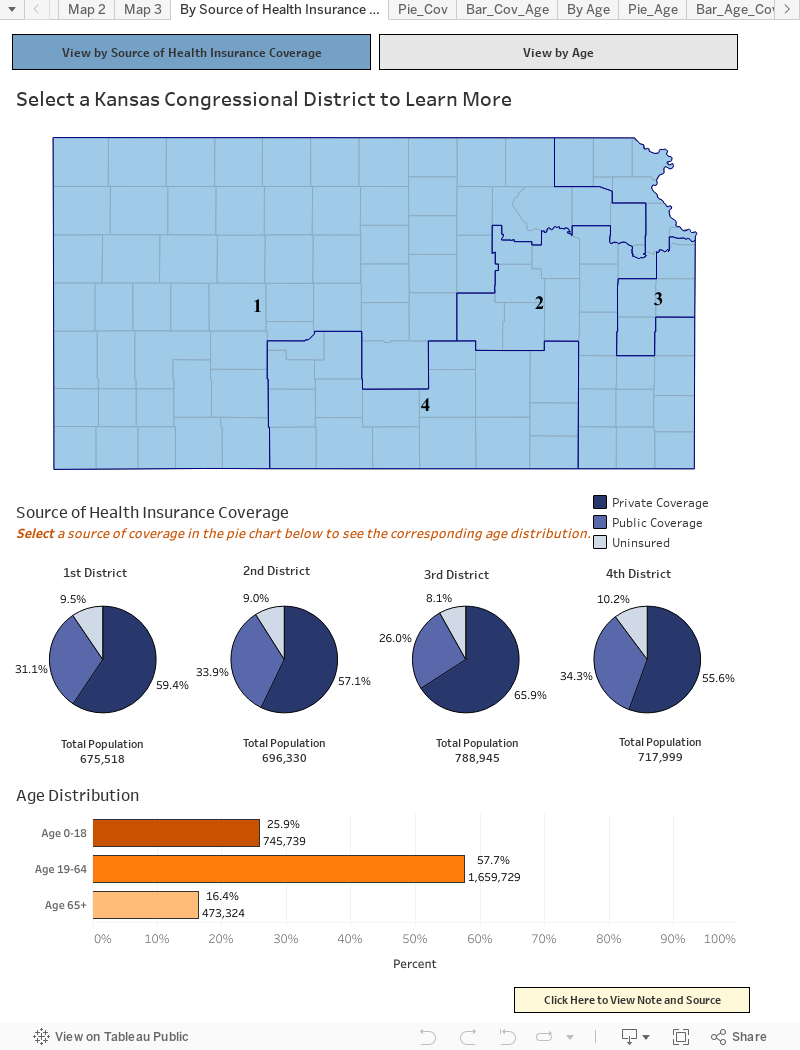
Health Insurance Coverage by Age and Congressional District
Kansas Overall
| Private Coverage | Public Coverage | Uninsured | |||||
|---|---|---|---|---|---|---|---|
| 2021 | Total Population | Number | Percentage | Number | Percentage | Number | Percentage |
| Kansas Overall |
2,878,792 | 1,717,792 | 59.7% | 897,270 | 31.2% | 263,730 | 9.2% |
| Children, Age 0-18 |
745,739 | 464,443 | 62.3% | 243,731 | 32.7% | 37,565 | 5.0% |
| Adults, Age 19-64 |
1,659,729 | 1,239,425 | 74.7% | 196,046 | 11.8% | 224,258 | 13.5% |
| Adults, Age 65+ |
473,324 | 13,924 | 2.9% | 457,493 | 96.7% | 1,907 | 0.4% |
1st District
| Private Coverage | Public Coverage | Uninsured | |||||
|---|---|---|---|---|---|---|---|
| 2021 | Total Population | Number | Percentage | Number | Percentage | Number | Percentage |
| 1st Disrict |
675,518 | 401,132 | 59.4% | 210,313 | 31.1% | 64,073 | 9.5% |
| Children, Age 0-18 |
178,981 | 112,760 | 63.0% | 56,242 | 31.4% | 9,979 | 5.6% |
| Adults, Age 19-64 |
383,880 | 286,321 | 74.6% | 43,694 | 11.4% | 53,865 | 14.0% |
| Adults, Age 65+ |
112,657 | 2,051 | 1.8% | 110,377 | 98.0% | 229 | 0.2% |
2nd District
| Private Coverage | Public Coverage | Uninsured | |||||
|---|---|---|---|---|---|---|---|
| 2021 | Total Population | Number | Percentage | Number | Percentage | Number | Percentage |
| 2nd Disrict |
696,330 | 397,900 | 57.1% | 235,765 | 33.9% | 62,665 | 9.0% |
| Children, Age 0-18 |
169,915 | 106,709 | 62.8% | 53,761 | 31.6% | 9,445 | 5.6% |
| Adults, Age 19-64 |
400,371 | 288,050 | 71.9% | 59,533 | 14.9% | 52,788 | 13.2% |
| Adults, Age 65+ |
126,044 | 3,141 | 2.5% | 122,471 | 97.2% | 432 | 0.3% |
3rd District
| Private Coverage | Public Coverage | Uninsured | |||||
|---|---|---|---|---|---|---|---|
| 2021 | Total Population | Number | Percentage | Number | Percentage | Number | Percentage |
| 3rd Disrict |
788,945 | 519,806 | 65.9% | 205,220 | 26.0% | 63,919 | 8.1% |
| Children, Age 0-18 |
204,820 | 141,831 | 69.2% | 55,066 | 26.9% | 7,923 | 3.9% |
| Adults, Age 19-64 |
467,641 | 372,766 | 79.7% | 39,698 | 8.5% | 55,177 | 11.8% |
| Adults, Age 65+ |
116,484 | 5,209 | 4.5% | 110,456 | 94.8% | 819 | 0.7% |
4th District
| Private Coverage | Public Coverage | Uninsured | |||||
|---|---|---|---|---|---|---|---|
| 2021 | Total Population | Number | Percentage | Number | Percentage | Number | Percentage |
| 4th Disrict |
717,999 | 398,954 | 55.6% | 245,972 | 34.3% | 73,073 | 10.2% |
| Children, Age 0-18 |
192,023 | 103,143 | 53.7% | 78,662 | 41.0% | 10,218 | 5.3% |
| Adults, Age 19-64 |
407,837 | 292,288 | 71.7% | 53,121 | 13.0% | 62,428 | 15.3% |
| Adults, Age 65+ |
118,139 | 3,523 | 3.0% | 114,189 | 96.7% | 427 | 0.4% |
Note: Civilian non-institutionalized Kansas residents = 2,878,792. Estimates are for residents within the congressional district boundaries of the 117th Congress which are in effect from January 3, 2021 – January 3, 2023. Percentages may not sum to 100 percent due to rounding. Margins of error for combined population subgroups are not available, so statistical tests for significant differences cannot be conducted. Since ACS respondents can report more than one type of insurance, KHI utilizes a standard hierarchy of public, private and then uninsured.
Source: KHI analysis of data from the U.S. Census Bureau 2021 1-year American Community Survey table B27010, available at https://data.census.gov/cedsci/table?q=B27010&g=0100000US_0400000US20,20%245000000&tid=ACSDT1Y2021.B27010
A PDF version of this fact sheet is also available in the Documents & Downloads section.
Learn More in this Video
About Kansas Health Institute
The Kansas Health Institute supports effective policymaking through nonpartisan research, education and engagement. KHI believes evidence-based information, objective analysis and civil dialogue enable policy leaders to be champions for a healthier Kansas. Established in 1995 with a multiyear grant from the Kansas Health Foundation, KHI is a nonprofit, nonpartisan educational organization based in Topeka.