A Glimpse Into Hospital Prices in Kansas

The Critical Role of Data in Understanding Health Care Spending

12 Min Read

May 24, 2021

By

Phillip Steiner, M.A.,

Wen-Chieh Lin, Ph.D., Linda J. Sheppard, J.D.
alt=""

Key Points

    • Kansas employers who provided claims data to the RAND Corporation Hospital Price Transparency Study on average paid 234 percent of the price Medicare would have paid for the same hospital inpatient and outpatient services in 2018.
    • The average price paid by self-insured employers for hospital outpatient services ranged from 338 percent of Medicare at hospitals in the Kansas City area to 182 percent of Medicare at hospitals in Southwest Kansas.
    • The average price paid for inpatient services ranged from 367 percent of Medicare at hospitals in the Kansas City area to 97 percent of Medicare at a hospital in Northwest Kansas.
    • Very limited health care pricing data are available for analysis in Kansas. While it is possible some of the reported variation in prices among hospitals is due to differences in the type of hospital or service and payer mix, having more data available would allow for a more robust analysis to answer key questions about the cost of health care in Kansas.
    • The federal Consolidated Appropriations Act of 2021 establishes a $2.5 million grant to states that apply and are approved to create or improve All-Payer Claims Databases, a crucial tool to understanding and addressing high health care costs.

Introduction

Lowering the cost of health care is consistently one of the top priorities for Americans. Prior to the COVID-19 pandemic, public opinion polls found that more than two-thirds of Americans, regardless of party affiliation, considered lowering the cost of health care to be very or extremely important. Health care spending is determined by the number of people served, the number of services provided and the amount paid per service.

While consumers are concerned about the cost of health care overall, the prices paid for hospital services across Kansas are the focus of this brief. Hospitals accounted for the largest share (37 percent) of the $3.2 trillion in national health care spending in 2019, and the largest share (39 percent) of the $22.2 billion spent in Kansas in 2014, the most recent estimate available.

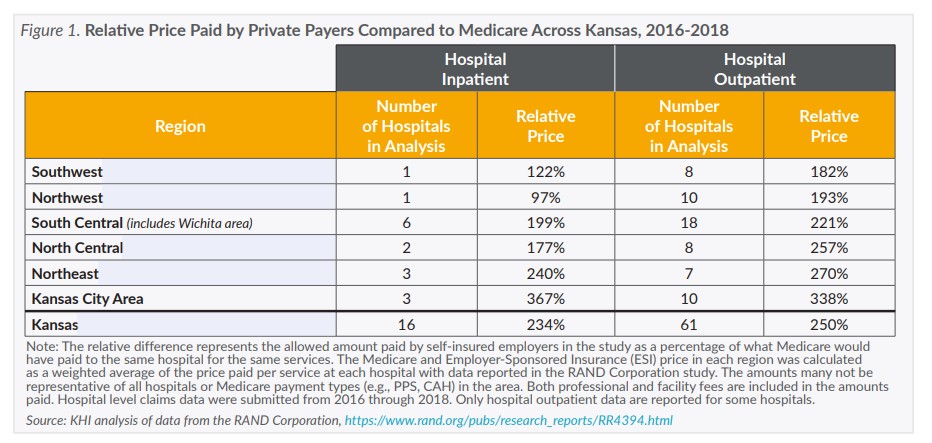
Using data from a recently released study by the RAND Corporation, this issue brief finds that hospital prices paid for hospital services by self-insured employers vary at least two- to three-fold in Kansas. Higher prices lead to higher health care spending, which is directly reflected in the out-of-pocket cost’s consumers pay and the increasing cost of health insurance premiums for employers and consumers.

The RAND study summarizes 2016 through 2018 claims submitted by community hospitals across the nation. The study includes claims submitted to self-insured employers from 49 states (including Kansas) and Washington, D.C., and additional claims submitted to private payers (e.g., insurance companies) as recorded in All Payer Claims Databases in six states (Connecticut, Colorado, Delaware, Maine, New Hampshire and Rhode Island). The study provides a first look at variations in hospital prices across Kansas and makes the case for a more comprehensive source of information on health care prices. A new federal funding opportunity discussed on page 4 could improve access and availability of claims data for understanding health care prices in Kansas.

How are Hospital Prices Set?

The price for hospital services would ideally use a systematic methodology that balances the cost to the provider of organizing and delivering services and the need of the payer to manage financial risk. However, the methods used by payers to establish prices are many and complex. The RAND study’s analytical approach was based on the Fee-For-Service (FFS) payment model. The FFS payment model sets a price for every individual health care item, service or bundle of services and in most cases providers are reimbursed at the set price regardless of the charged amount.

Pricing Services in Medicare

Medicare sets hospital prices in most cases using FFS formulas defined in federal statute and regulation. The pricing formulas vary by provider type and setting (e.g., hospital inpatient and outpatient departments), but there are common features among them. Each formula typically pays a base rate for an item, service or bundle that is adjusted to account for the complexity of the patient’s case, policy-based incentives (e.g., bonuses for meeting quality standards) and geographic factors like local wages or rurality. Because of these formulas there are minimal differences across individual providers in the prices paid for the same item or service in the same setting. In other words, hospitals within the same region should receive similar payments from Medicare for similar services. One notable exception relates to Critical Access Hospitals (CAHs), to which Medicare currently pays 101 percent of allowable costs in order to keep essential services in rural communities.

Pricing Services with ESI

Employer Sponsored Insurance (ESI) prices are determined through negotiations, and the contracts with providers are generally not available for public review. The negotiations likely consider factors including consultation with providers and outside experts, public data on quality, technology used, expected outcomes, geographic needs, efforts of network providers to consider social determinants of health, the cost of treatment and its effectiveness, the provider’s payer mix (e.g. the proportion of uninsured, Medicaid, Medicare and private insurance patients) and market power.

Market power is often cited as a significant factor in determining the prices paid for hospital services. Hospitals that are more in demand by patients are generally able to negotiate higher prices with payers, and conversely payers with a higher percentage of enrollees in a hospital’s service area generally can negotiate lower prices. There also is some limited evidence from one study in another state that insurance providers serving as third-party administrators may be willing to agree to higher prices for services provided to employees of self-insured employers because the third-party administrator bears less risk for these payments.

Why Do Hospital Prices Vary?

Despite the critical role of prices in overall spending, little is publicly known about why the prices that ESI pays vary or how those prices are determined. While this is beginning to change — as of January 1, 2021, hospitals are required by federal regulation to provide accessible pricing information online — some hospitals around the country are refusing to publish their prices or making them difficult to find, and court challenges are being launched. Even when prices are published online it is difficult for consumers to determine the quality or value, they are receiving for the prices paid and to understand more generally why prices vary among services and providers.

Differences in clinical quality and payer mix are often cited as a reason for price variation between hospitals. However, the RAND study found neither an association between ESI price and a hospital’s Medicare and Medicaid payer mix nor a strong correlation between price with either quality or patient safety. Although RAND standardized the prices paid at each hospital to make them comparable, they acknowledged that their methods may not have completely accounted for differences in payer mix and service intensity (e.g., the care coordination, type, number and frequency of providers required to meet patients’ needs) among hospitals.

Figure 1 Relative Price Paid by Private Payers Compared to Medicare Across Kansas 2016-2018

Comparing Prices Paid by ESI to Medicare

Figure 1 shows the relative price paid for hospital inpatient and outpatient services across six regions in Kansas. The RAND Corporation data show that on average the prices paid by self-insured ESI to hospitals in Kansas where 250 percent of the price Medicare would have paid for the same outpatient services and 234 percent for inpatient services between 2016 and 2018.

Within Kansas, the difference between the price paid by Medicare and ESI varied at least two- to three- fold by region for hospital inpatient and outpatient services. For example, the standardized price paid by ESI for an outpatient emergency department visit ranged from $156 at a hospital in south central Kansas to $703 at a hospital in the Kansas City area. Medicare would have paid $88 and $99 for those services respectively. According to Census Bureau data, about half (51.4 percent) of Kansans with ESI live in the Kansas City or Northeast region and about a third (32.0 percent) live in the South-Central region.

Medicare prices are not intended as a reference for the price that ESI should pay. Medicare prices are likely not sufficient for many hospitals to break even or make a profit. The Medicare Payment Advisory Commission found in its March 2020 report that Medicare profit margins for non-Critical Access Hospitals were negative 9.3 percent on average (margins are typically lower for Medicaid and uninsured patients).

How does Kansas Compare to the Rest of the Country?

Across the U.S. (excluding Maryland) private payers on average paid 247 percent of the price Medicare would have paid for the same services in 2018. Arkansas was the lowest among the 46 states reported in the study, with private payers paying about 186 percent of Medicare, while West Virginia was the highest with private payers paying about 351 percent of Medicare. Kansas was in the lower half of states reported. Figure 2 presents the results of the RAND study showing the price paid by private payers for hospital services compared to the price Medicare would have paid for the same services. In the figure, Kansas is shown with a select group of states, including Arkansas, West Virginia, New Mexico (the median state in the data reported) and nearby states.

Figure 2 Prices Paid by Private Payers Compared to Medicare in Kansas and Selected States 2018

All Payer Claims Databases: A New Opportunity for States

The summarized claims data provided by the RAND Corporation is one of the most complete data sets on hospital pricing publicly available at the provider level, but the findings in Kansas are based on relatively few claims submitted by few hospitals to self-insured employers. The claims data in the report represent $14.8 million in spending out of more than $8 billion in estimated hospital spending annually in Kansas. To get a more complete understanding of hospital prices and health care prices in general, more data are needed.

The federal Consolidated Appropriations Act of 2021 (Appropriations Act) includes legislation prohibiting surprise medical bills from out-of-network providers. Beginning in 2022, insurers and providers will not be able to bill consumers for costs outside of the agreed upon in-network rate and will have to negotiate with insurers to determine an appropriate rate or submit to arbitration. Recognizing that limited information exists for an arbiter to determine a fair price, the legislation established a one-time grant of $2.5 million paid over three years for each state to create or improve an All-Payer Claims Database (APCD). Recipients of the grants would be required to make data available to authorized users, including researchers, employers, health insurance issuers, third-party administrators, and health care providers for quality improvement, cost-containment, and other policy development purposes.

Kansas already maintains databases of health insurance claims information for KanCare (the Medicaid and Children’s Health Insurance Program) and the state employees’ health plan, as well as claims data submitted quarterly by private health insurance companies to the Kansas Health Insurance Information System (KHIIS), which includes data for around 800,000 individuals enrolled in fully insured health plans.

However, the databases do not have the characteristics of a robust APCD, as the data are not readily available to authorized users as described in the federal Appropriations Act and generally do not include data from self-insured ESI. Funding from the Appropriations Act could be used to combine the rich data from these three separate databases into a single comprehensive APCD and self-insured plans could be encouraged to contribute data to it on a voluntary basis. The resulting APCD also can be made to meet the requirements of the Appropriations Act to become available to authorized users.

The benefits of a comprehensive, standardized health care claims data source are many. The improved data would allow policy makers and the public to better understand how price and spending are related to quality of care, whether care is delivered equitably and whether health care resources are distributed to providers with the highest cost or patients with the most complex needs. Additionally, employers, insurance plans, state officials and other policymakers could utilize the data to monitor and evaluate public programs, reduce spending and identify ways to improve population health.

Conclusion

The dataset published by the RAND Corporation provides important insight into the prices for hospital services in Kansas and a comparison to Medicare as a benchmark. State policymakers may want to consider the opportunity provided by the Consolidated Appropriations Act of 2021 to enhance the comprehensiveness, availability and usefulness of the three separate databases and increase the state’s capacity to analyze data on health care prices in Kansas. Working toward a fully functional All-Payer Claims Database for Kansas would provide essential and rich information to insurers, payers and policymakers and support a comprehensive discussion of issues related to health care costs in Kansas.

Glossary of Terms

  • Employer-Sponsored Insurance (ESI): Health insurance offered by employers to employees and dependents. These private-payer plans are either:
    a. Fully Insured: An insurance provider administers claims and bears the financial risk of healthcare spending. The employer and employees pay premiums to the health insurer.
    b. Self-Insured: An insurance provider administers claims on behalf of an employer (typically employers with 50 or more employees). The employer bears the financial risk of health care spending and employees pay a premium to the employer.
  • Charged Amount: The amount set by a provider, such as a hospital, for health care services, before discounts are applied. 
  • Price: The term used throughout this brief for the allowed amount, which is an amount negotiated by a health insurance company or set by a government agency to pay providers for health care services. It is the combination of payments made by the insurer and the patient’s co-pays, co-insurance and deductibles.

About Kansas Health Institute

The Kansas Health Institute supports effective policymaking through nonpartisan research, education and engagement. KHI believes evidence-based information, objective analysis and civil dialogue enable policy leaders to be champions for a healthier Kansas. Established in 1995 with a multiyear grant from the Kansas Health Foundation, KHI is a nonprofit, nonpartisan educational organization based in Topeka.

Learn More About KHI