Uninsured Rate for Nonelderly Adults Varies Widely Across Kansas Counties

3 Min Read

Dec 05, 2018

By

Sydney McClendon,

Madison Hoover, M.S.,

Wen-Chieh Lin, Ph.D.
alt=""

Introduction

Earlier this year, the U.S. Census Bureau released the 2016 Small Area Health Insurance Estimates (SAHIE) providing county-level uninsured rates. This fact sheet focuses on the latest available data for nonelderly Kansas adults age 19-64 by county. While the 2017 statewide uninsured rate was published in a September 2018 KHI press release, the more-detailed data presented in this fact sheet is one year older due to when the Census Bureau releases it.

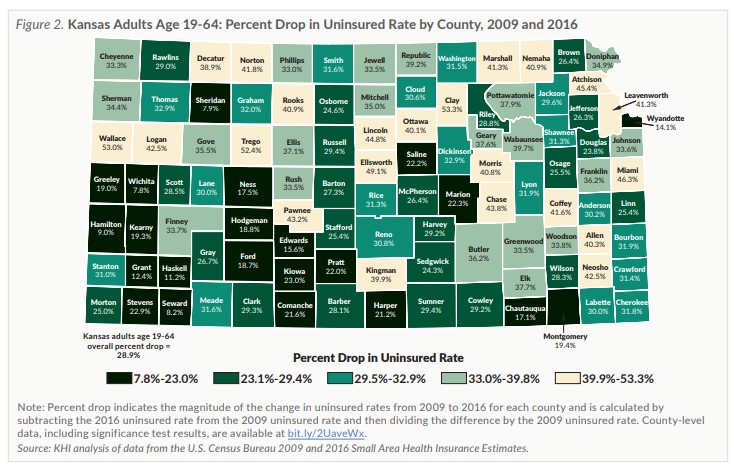
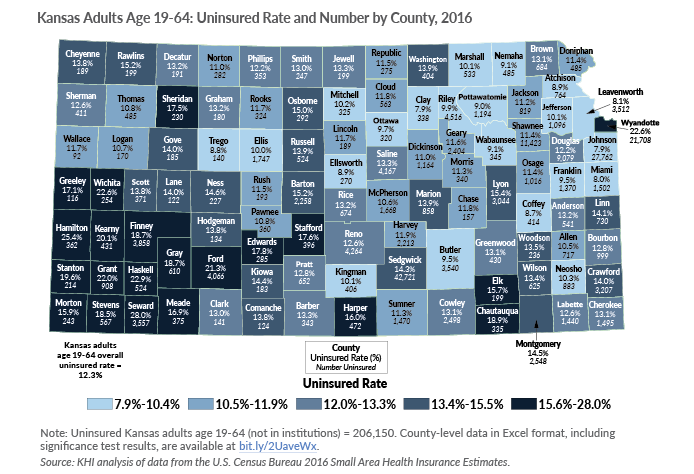
In 2016, the overall uninsured rate among Kansas nonelderly adults age 19-64 fell to 12.3 percent (206,150 uninsured), a drop of more than one-quarter since the implementation of the Affordable Care Act (from 17.3 percent in 2009 to 12.3 percent in 2016; a 28.9 percent drop). While Kansas has made strides in reducing the uninsured rate for nonelderly adults, health insurance remains unaffordable for many adults in Kansas. This fact sheet provides county-specific uninsured rates for Kansas nonelderly adults (Figure 1, above) based on the 2016 SAHIE data and changes in uninsured rates between 2009 and 2016 for each Kansas county (Figure 2).

Map of Kansas showing Kansas adults percent drop in uninsured rate by county refer to the data on this page for specific details.

2016 Uninsured Rate by County

    • There was more than a three-fold difference between the highest and lowest county uninsured rate for nonelderly adults in 2016:28.0 percent in Seward County and 7.9 percent in Johnson County and Clay County.
    • Counties in southwest Kansas generally had the highest uninsured rates for nonelderly adults. Wyandotte County in northeast Kansas also had one of the highest rates(22.6 percent).

Change in Uninsured Rate by County Between 2009 and 2016

Figure 2 indicates the magnitude of the change in uninsured rate from 2009 to 2016 for each county.

    • Between 2009 and 2016, Clay County had the largest drop in the uninsured rate for nonelderly adults (53.3 percent), while Wichita County had the smallest drop (7.8 percent).
    • Counties in the southwestern part of the state generally had smaller drops in their uninsured rates.

Conclusion

While almost all Kansas counties significantly improved their uninsured rate for nonelderly adults over the last eight years, large differences remain between the highest and lowest uninsured rate. In general, higher uninsured rates were more common in the southwestern part of the state, which also experienced smaller coverage gains between 2009 and 2016. The variation between counties and regions may be driven by community-level factors, which could include the local economy, demographic makeup and outreach efforts.

Technical Note

The U.S. Census Bureau Small Area Health Insurance Estimates (SAHIE) is the only data source for county-specific, single-year estimates for health insurance coverage (census.gov/programs-surveys/sahie/about.html). SAHIE estimates for health insurance coverage at the state level could differ slightly from those derived from other data sources because of differences in methodology.

About Kansas Health Institute

The Kansas Health Institute supports effective policymaking through nonpartisan research, education and engagement. KHI believes evidence-based information, objective analysis and civil dialogue enable policy leaders to be champions for a healthier Kansas. Established in 1995 with a multiyear grant from the Kansas Health Foundation, KHI is a nonprofit, nonpartisan educational organization based in Topeka.

Learn More About KHI