Introduction
Earlier this year, the U.S. Census Bureau released the 2016 Small Area Health Insurance Estimates (SAHIE) providing county-level uninsured rates. This fact sheet focuses on the latest available data for Kansas children age 0-18 by county. While the 2017 statewide uninsured rate was published in a September 2018 KHI press release, the more-detailed data presented in this fact sheet is one year older due to when the Census Bureau releases it.
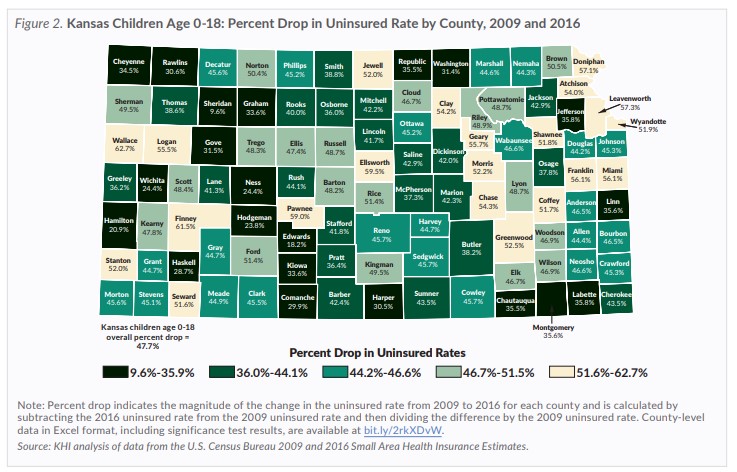
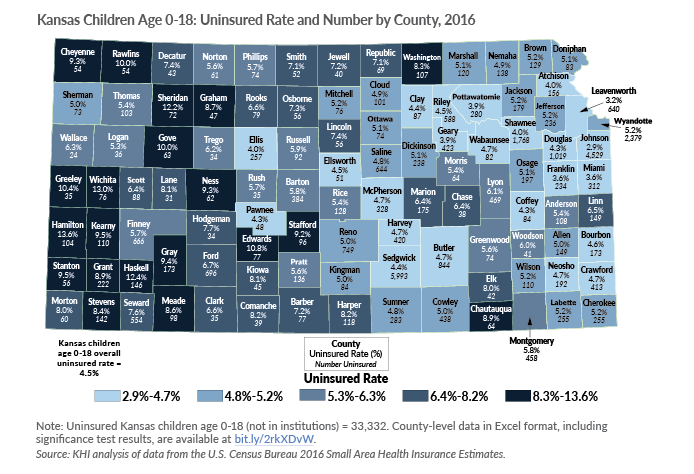
In 2016, the overall uninsured rate among Kansas children age 0-18 reached an all-time low of 4.5 percent (33,332 uninsured children), a drop by nearly half since the implementation of the Affordable Care Act (from 8.6 percent in 2009 to 4.5 percent in 2016; a 47.7 percent drop). While health insurance coverage for Kansas children overall has improved over the last decade, the progress varies by county. This fact sheet provides county-specific uninsured rates for children in 2016 (Figure 1, above), as well as changes in uninsured rates between 2009 and 2016 for each Kansas county (Figure 2).