Interpreting Early Medicaid Expansion Results

How have states been impacted so far?

10 Min Read

Sep 07, 2016

By

Andrea N. Hinton,

Linda J. Sheppard, J.D.
alt=""

Introduction

More than six years after passage of the Affordable Care Act (ACA), 32 states, including the District of Columbia, have expanded or are in the process of expanding their Medicaid programs, while 19 states continue to debate the issue (Figure 1). This brief examines the types of Medicaid expansion, how states are measuring impact and what to look for in the future.

alt=""

Up to now, states have taken one of two approaches to Medicaid expansion:

Traditional Medicaid expansion: Raising the eligibility level of their existing programs to138 percent of the federal poverty level (FPL)($33,534 for a family of four in 2016) as called for in the law. Alternative Medicaid expansion: Submitting a plan to the U.S. Department of Health and Human Services, Centers for Medicare and Medicaid Services (CMS), known as a Section1115 demonstration, which, if approved, allows states to take a non-traditional approach to expanding their Medicaid programs for this new population. To date, most states have chosen the traditional approach. However, six states—most of which have Republican leadership—have tailored their expansions through demonstration waivers. In states that are still considering expansion, policymakers are interested in the outcomes experienced by states that have already expanded, particularly regarding enrollment and cost. Under the ACA, states could expand Medicaid effective January 1, 2014, but not all states implemented expansion by that date. After only two years or less of expansion, data describing the experiences of expansion states is limited.

What Has Been Approved?

Alternative expansion states have taken unique, nontraditional approaches to expansion in their Section1115 demonstration plans submitted to CMS. However, not all of the principles proposed by these states have been approved (Figure 2).CMS has consistently approved expansion plans that include healthy behavior incentives, which can lower out-of-pocket costs to enrollees who complete health risk assessments or wellness visits. However, CMS has repeatedly rejected proposals that require enrollees to fulfill certain work requirements in order to remain eligible for coverage. With the election of a new president in November 2016, states submitting expansion plans in 2017 and beyond face uncertainty about how CMS will view such proposals.

alt=""

Doing the Math

For policymakers and other stakeholders attempting to draw conclusions about the early results experienced by expansion states, there are several key issues and factors to consider.

Enrollment results. One of the most important issues to consider is the experience of expansion states with actual versus projected enrollment.

The categorization of enrollees has major cost implications. Under the ACA, the costs for newly eligible enrollees are reimbursed by the federal government to states at a higher rate than costs for previously eligible enrollees.

For 2014 through 2016, the federal government reimbursed states for 100 percent of the costs for newly eligible enrollees. Beginning in 2017, the federal share begins to taper off—down to 90 percent by 2020—where it will remain, with states responsible for picking up the remaining costs.

The costs for previously eligible enrollees are reimbursed at the less-generous levels of the regular Federal Medical Assistance Percentage (FMAP) rate, which varies from 50 percent in some states to 83 percent in other states. In Kansas, the regular FMAP rate is 55.96 percent for the 2016federal fiscal year, with the state paying the remaining 44.04 percent of costs.

The average enrollment increase over the first two years of expansion was 37 percent for expansion states and 12 percent for non-expansion states.

Early results show that expansion states are experiencing higher-than-expected numbers of newly eligible enrollees. When developing expansion projections, states have relied on U.S. Census Bureau data to identify the number of individuals who may be newly eligible, based on their income. However, states also consider that some of those individuals may already have health coverage through an employer or another source, or may simply choose not to obtain coverage. This makes it difficult for states to develop accurate projections.

alt=""

Expansion states may experience crowd-out, which occurs when newly eligible individuals with private health insurance drop that coverage and enroll in Medicaid because the state’s Medicaid program offers more generous benefits or is less expensive than their current coverage.

Finally, a factor that can have serious consequences for state budgets is the so-called woodwork effect, which suggests that increased awareness of Medicaid causes previously eligible people to enroll. This is financially significant for states because the costs for these new enrollees are reimbursed by the federal government at regular FMAP rates, meaning that states spend more money on previously eligible enrollees than newly eligible enrollees. The woodwork effect can occur in all states, even those that haven’t expanded Medicaid.

Characteristics of the expansion population. The age and health status of Medicaid enrollees are factors that can also influence Medicaid spending. In developing enrollment and cost projections, states also attempted to make demographic projections about potential new enrollees.

For example, a quarterly report by Arkansas’ state health department revealed that for the first seven months of2014, the Medicaid expansion population was older than expected, with an average enrollee age of 38.8 years compared to the expected 37.0 years. This outcome may have contributed to the higher-than-expected costs seen in Arkansas’ first year of expansion.

Spending on the newly eligible. Total cost equals the average cost per-member times the total number of members enrolled. Under approved Section 1115demonstration waivers, alternative Medicaid expansion programs must be equally or less expensive than traditional Medicaid expansion programs. The federal government compares actual costs to a per-member-per-month (PMPM)estimate, sometimes referred to as a “budget cap,” in order to assess a program’s financial impacts.

Some alternative expansion states currently report per member spending under their PMPM “budget cap.” However, if they have experienced higher-than-expected enrollment, they will need to address the overall effect on the state’s share of Medicaid costs for the expansion population. This becomes an issue because, in 2017, states will begin paying 5 percent of the costs for the newly eligible, rising to 10 percent by 2020.

Looking Ahead: What to Watch

State contributions to future financing. With the federal share of costs for the expansion population dropping to 95 percent, 2017 will be a critical year for Medicaid expansion states as they begin paying for their newly eligible populations. A major debate has taken place instates over the impact this will have on state budgets and what new revenue could be used to pay for these costs. Some state legislatures have generated “pay-for” revenue. For example, in Indiana, a cigarette tax increase and additional contributions from hospitals will be used to cover some of the costs of Medicaid expansion.

alt=""

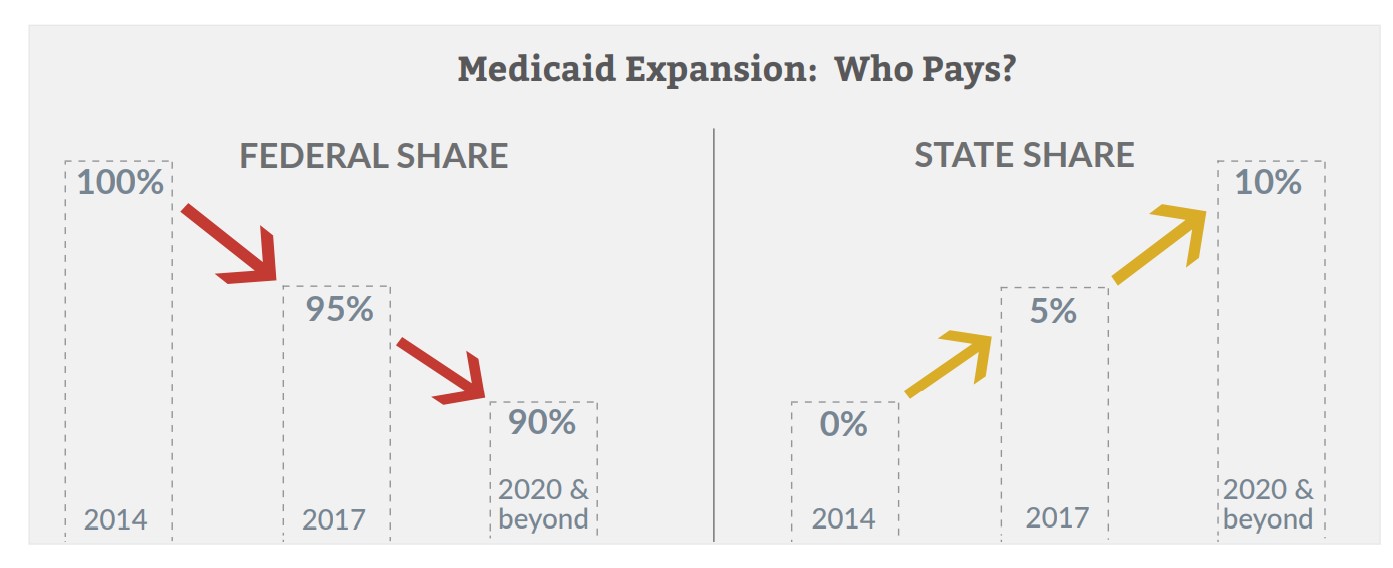
Federal costs. As an incentive to states that have not yet expanded, the Obama administration has proposed that the federal government pay 100 percent of the costs of newly eligible enrollees for the first three years of their expansion, regardless of when it begins. However, per-member costs for newly eligible adults in 2015were 49 percent higher than federal projections, raising questions about whether the next Congress or the new President would support such a proposal. How expansion affects health and quality-of-life. Though many states have expanded Medicaid, little data currently exist on the impact expansion has had on health outcomes. A widely cited, pre-ACA example of the health effects of Medicaid expansion is the Oregon Health Insurance Experiment. After randomly selecting and enrolling thousands of Oregonians from a waiting list to the state’s limited-availability Medicaid program in2008, researchers were able to evaluate the differences in health outcomes between the “selected enrollees” and the “non-enrollees” still on the waiting list after two years of the program.

The study found an overall increase in use of all types of health care services by the selected enrollees, including increased use of preventive care and prescription drugs, cholesterol monitoring and mammogram screenings, higher rates of diabetes detection and management, and reduced rates of depression. Although the selected enrollees showed increased use of health care services, there was no significant improvement in objective health measures such as blood pressure, cholesterol or blood sugar levels. However, the selected enrollees were more likely to report their health status as “good to-excellent” and were less likely to report financial hardship related to medical expenses as compared to the non-enrollees.

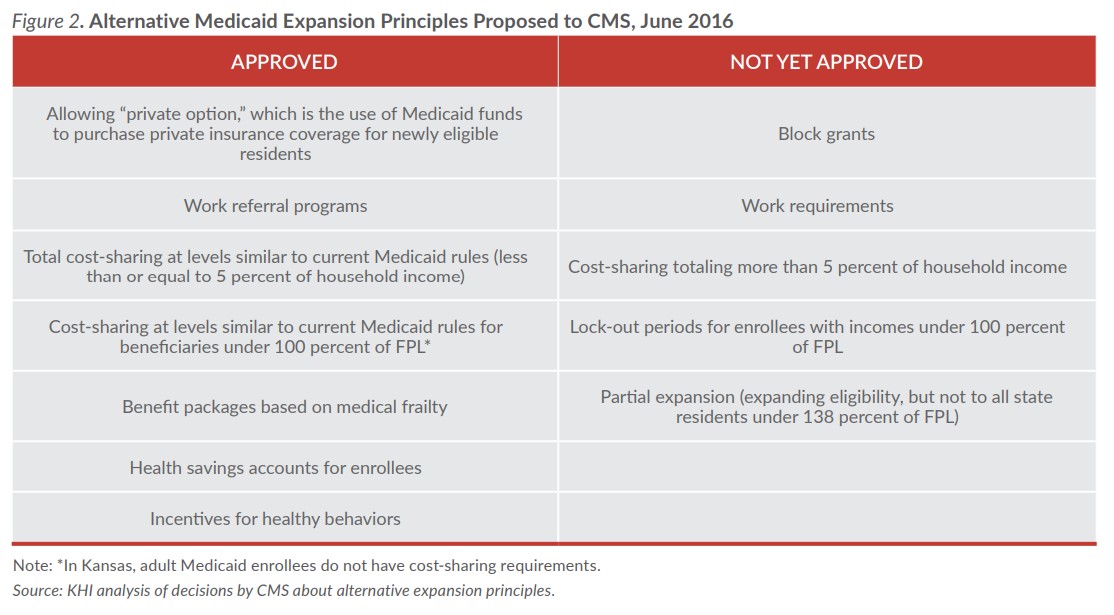
How the expansion population uses services. An often stated goal of Medicaid expansion is to decrease the number of emergency department (ED) visits, as many individuals who may have sought care through the ED would now have access to primary care physicians. The Oregon study also evaluated health care utilization and found that the selected enrollees had more office visits in the previous year than the non enrollees. However, they also found an increase in the number of ED visits, including non-emergency or primary care visits. This finding suggests that insurance coverage may not immediately impact the behaviors of the previously uninsured. What alternative programs might include. Thus far, states have been allowed to include a number of new principles in their alternative Medicaid expansion programs, including having enrollees with incomes below the federal poverty level pay premiums and/or copayments, creating health savings accounts, providing incentives for healthy behaviors, and using Medicaid funds to purchase private insurance. One of the most heated debates between states and CMS has been over work requirements, which the Obama administration has not allowed. The election of a new president in November may bring a new stance on this provision, which could lead some of the remaining non-expansion states to reconsider a state specific plan.

Conclusion

As states continue to weigh the pros and cons of Medicaid expansion, early experiences in other states can help inform legislative decisions. To date, expansion states have seen higher-than-expected Medicaid enrollment, but cost results have been mixed, and there is, so far, limited data on the effect of expansion on health outcomes.

As time passes and more results from early expansion states become available for analysis, policymakers who are still considering Medicaid expansion may find clearer information to inform their decisions.

Access additional State Spotlights in the Documents & Downloads section.


About Kansas Health Institute

The Kansas Health Institute supports effective policymaking through nonpartisan research, education and engagement. KHI believes evidence-based information, objective analysis and civil dialogue enable policy leaders to be champions for a healthier Kansas. Established in 1995 with a multiyear grant from the Kansas Health Foundation, KHI is a nonprofit, nonpartisan educational organization based in Topeka.

Learn More About KHI