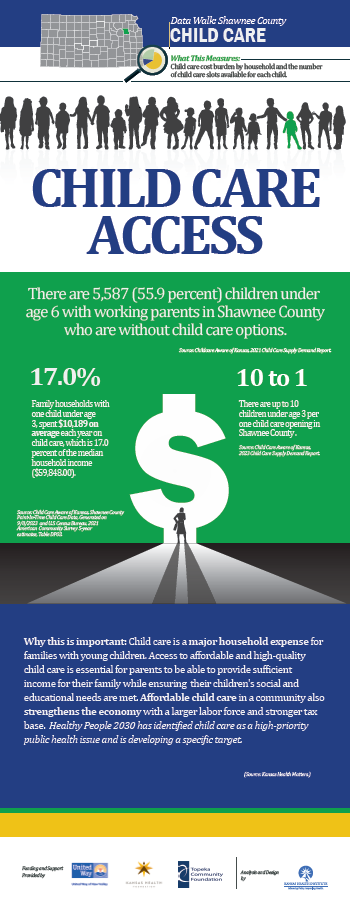
Infant Mortality
What This Measures
The rate of infant deaths (prior to 1 year of age) per 1,000 live births by race and ethnicity.
Contrasting Rates
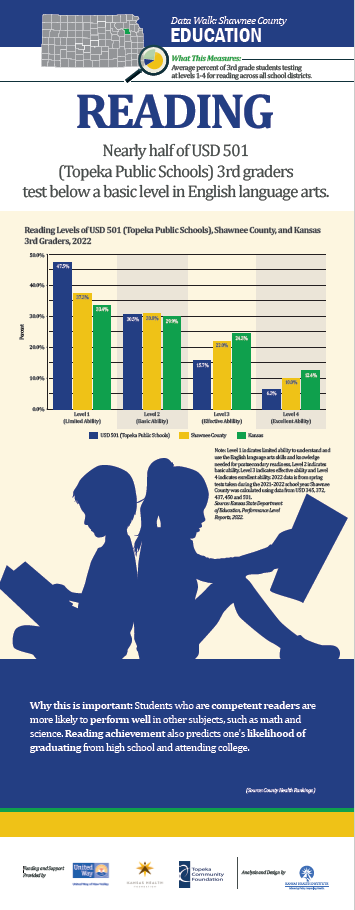
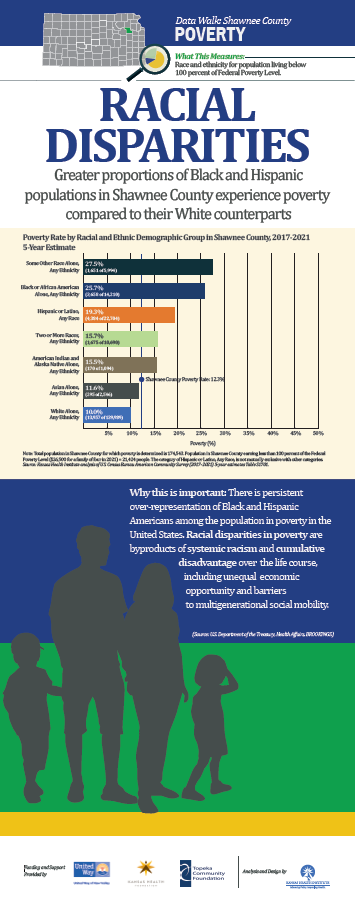
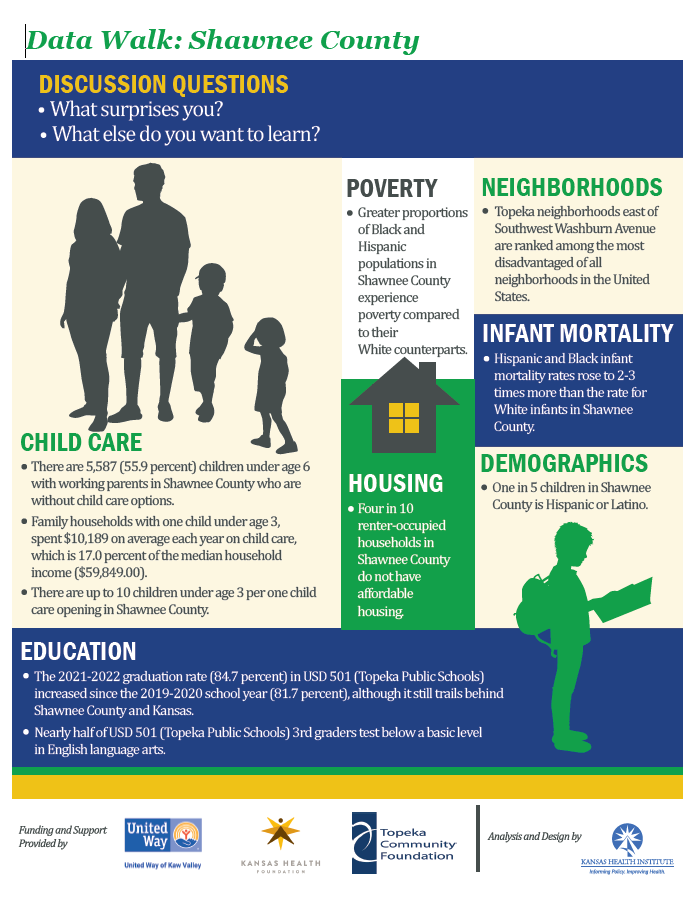
Hispanic and Black infant mortality rates rose to 2-3 times more than the rate for White infants in Shawnee County.
Line Chart: Infant Mortality Rate (Deaths per 1,000 Live Births) by Race and Ethnicity in Shawnee County, 2013-2021 Five-Year Estimates
Healthy People 2030 Goal
Healthy People 2030 Goal: 5.0 deaths per 1,000 live births
2013-2017 5-Year Estimate
Black/African American: 13.7 deaths per 1,000 live births
Hispanic: 8.8 deaths per 1,000 live births
White: 6.3 deaths per 1,000 live births
2014-2018 5-Year Estimate
Black/African American: 14.7 deaths per 1,000 live births
Hispanic: 11.1 deaths per 1,000 live births
White: 5.7 deaths per 1,000 live births
2015-2019 5-Year Estimate
Black/African American: 14.8 deaths per 1,000 live births
Hispanic: 12.0 deaths per 1,000 live births
White: 5.4 deaths per 1,000 live births
2016-2020 5-Year Estimate
Black/African American: 14.8 deaths per 1,000 live births
Hispanic: 14.2 deaths per 1,000 live births
White: 5.7 deaths per 1,000 live births
2017-2021 5-Year Estimate
Black/African American: 17.4 deaths per 1,000 live births
Hispanic: 11.9 deaths per 1,000 live births
White: 4.6 deaths per 1,000 live births
Note: Infant Mortality rate overall for Shawnee County was 8.2 deaths per 1,000 live births and for Kansas was 5.9 deaths per 1,000 live births (2017-2021 five-year estimate).
Source: Kansas Department of Health and Environment five-year estimates, 2013-2021, accessed through Kansas Health Matters.
Why This is Important
Infant death is a relatively rare event in most counties. Nationally, thousands of infants die per year from causes such as low birth weight, congenital malformations, and sudden infant death syndrome. Significant health disparities exist, particularly for Black infants in Kansas, who had three times the infant mortality rate (13.6 deaths per 1,000 live births) than White infants (4.5 deaths per 1,000 live births) in 2021. Keeping infants healthy begins with access to high-quality care during pregnancy. The Healthy People 2030 goal is to decrease the rate of infant deaths to 5.0 per 1,000 live births.
Source: Kansas Health Matters, County Health Rankings, Healthy People 2030, U.S. Department of Health and Human Services Office of Minority Health, Kansas Department of Health and Environment.
Funding and Support Provided by
United Way of Kaw Valley
Kansas Health Foundation
Topeka Community Foundation
Analysis and Design by
Kansas Health Institute