


Uninsured Rates in Expansion and Non-Expansion States
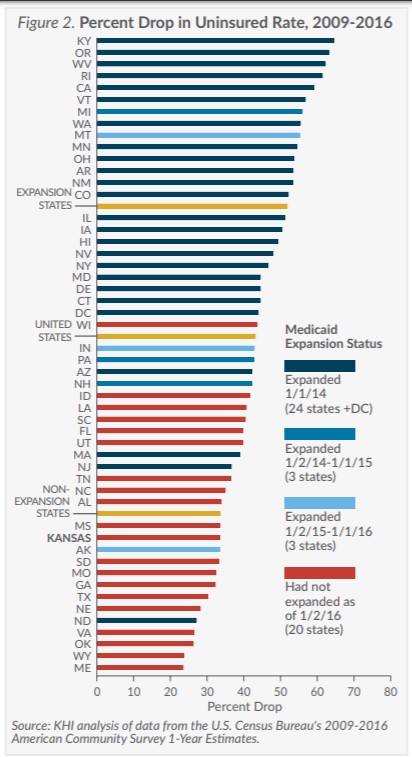
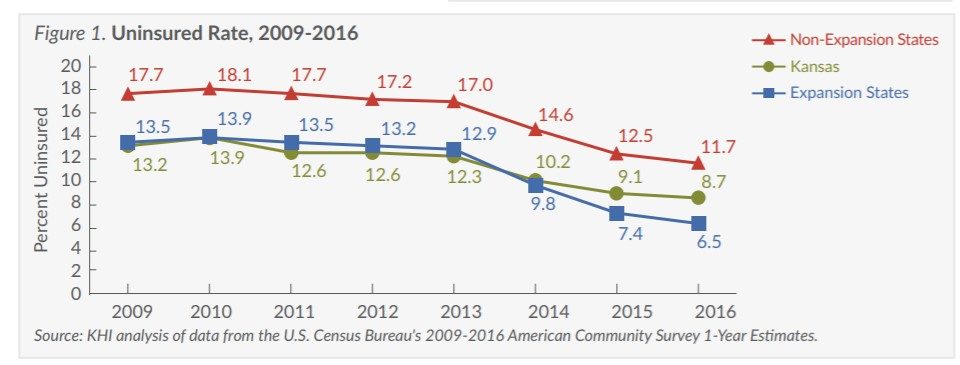
Since the Affordable Care Act (ACA) allowed states to expand their Medicaid programs beginning on January 1, 2014, 30 states and the District of Columbia had actually expanded their programs as of January 2016. This Fact Sheet compares changes in health insurance coverage in Kansas, other non-expansion states and expansion states before and after implementation of the major insurance expansion provisions of the ACA. (Figures 1 and 2)
- Even without Medicaid expansion, the uninsured rate in Kansas dropped by one-third from 2009 to 2016 (from 13.2 percent to 8.7 percent). However, this decrease ranks Kansas 40th for improvement over that time.
- Non-expansion states had an uninsured rate 1.3 times higher than expansion states even before the implementation of the ACA (17.7 percent compared to 13.5 percent in 2009). Since that time, the gap has widened and now non-expansion states have an uninsured rate 1.8 times higher than expansion states (11.7 percent compared to 6.5 percent in 2016)
Change in Uninsured Rate Among the Poor
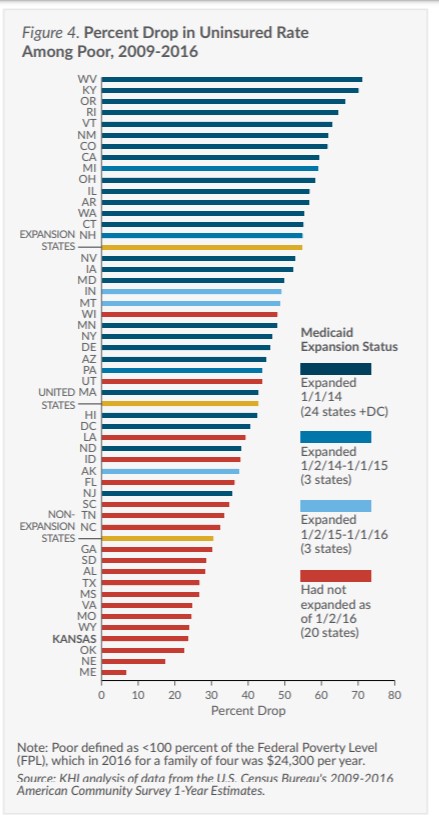
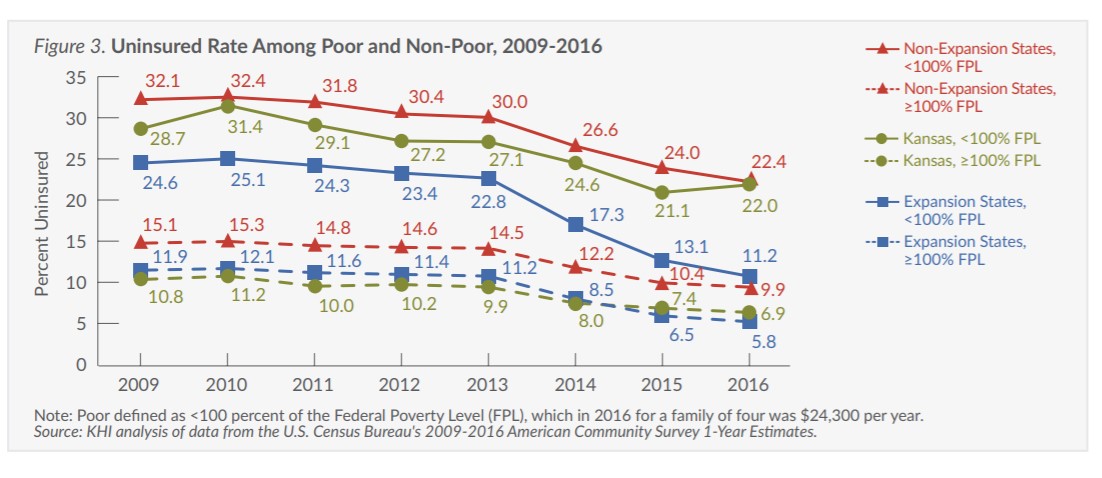
While Medicaid expansion is a major factor, other policy decisions made by states also influence insurance coverage, especially among the poor and minorities. Comparing the change in insurance coverage in Kansas to that in other non-expansion states can highlight how other policy decisions affect insurance coverage. (Figures 3 and 4)
-
- The uninsured rate for poor Kansans dropped from 28.7 percent in 2009 to 22.0 percent in 2016, the fourth smallest improvement among all states.
- Poor Kansans were 2.7 times more likely to be uninsured than non-poor Kansans prior to the ACA (28.7 percent compared to 10.8 percent in 2009), and are now 3.2 times more likely to be uninsured (22.0 percent compared to 6.9 percent in 2016).
- The poor in non-expansion states were 1.3 times more likely to be uninsured than those in expansion states prior to the ACA (32.1 percent compared to 24.6 percent in 2009). Now, the poor in non-expansion states are twice as likely to be uninsured as the poor in expansion states
- The uninsured rate among the poor in expansion states is now nearly the same as the uninsured rate among the non-poor in non-expansion states (11.2 percent compared to 9.9 percent in 2016).
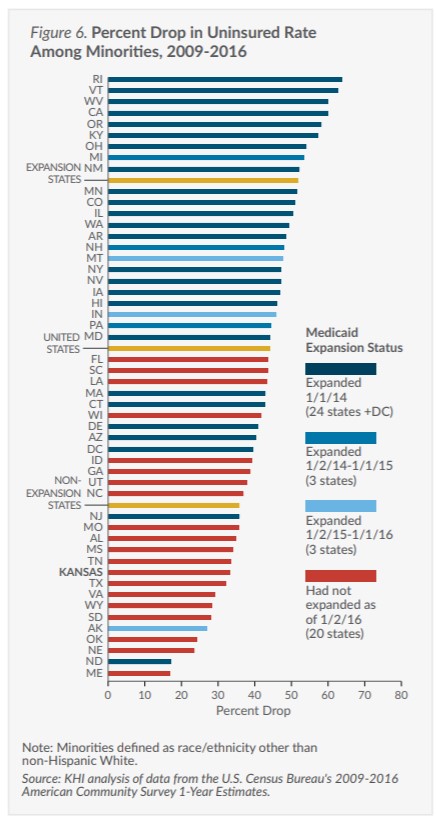
Change in Uninsured Rate Among Minorities
Minorities have had higher uninsured rates than non-Hispanic Whites since first measured in the U.S. Many historic, economic and social factors explain this persistent inequity. State policies can reduce the inequity by addressing the higher uninsured rates among minorities. (Figures 5 and 6)
-
- The uninsured rate among minorities in Kansas dropped by one-third from 2009 to 2016 (24.4 percent compared to 16.3 percent), but this gain ranks Kansas 42nd for improving the uninsured rate among minorities.
- Minority Kansans were 2.4 times more likely to be uninsured than non-Hispanic White Kansans in 2009 (24.4 percent compared to 10.3 percent), and were 2.5 times more likely to be uninsured in 2016 (16.3 percent compared to 6.4 percent).
- Minorities in non-expansion states were 1.3 times more likely than those in expansion states to be uninsured prior to the ACA (27.4 percent compared to 20.8 percent in 2009). Following Medicaid expansion in some states, minorities in non-expansion states are now 1.8 times more likely than those in expansion states to be uninsured (17.6 percent compared to 10.0 percent in 2016).
- The gap between the uninsured rate among minorities in expansion states and non-Hispanic Whites in non-expansion states has narrowed considerably from 2009 (20.8 percent compared to 12.3 percent) to 2016 (10.0 compared to 7.9 percent).
Policy Implications
Medicaid expansion under the ACA has improved insurance coverage significantly, including among poor and minority Americans. However, even states that have not expanded their Medicaid programs have experienced significant improvements in coverage since the implementation of the ACA. These improvements may reflect a strengthening economy over that time, as well as other elements of the ACA that affect insurance coverage. These include the expansion of private insurance coverage through subsidies to low- and middle-income families, the improved availability of coverage to individuals with pre-existing conditions, and the employer and individual mandates that create a financial incentive to have insurance.
The ACA has also increased the level of activity of state agencies and health care advocates on outreach and enrollment to communities with high uninsured rates. Finally, increased awareness and participation among those previously eligible but not enrolled in public insurance has led to increased coverage.
Understanding the effects of Medicaid expansion and other efforts to improve insurance coverage may help policymakers considering expansion of Medicaid and other strategies for ensuring access to care, such as enhanced funding for safety net clinics.
Technical Notes
The ACA allowed states to expand Medicaid to all adults ages 19-64 with family incomes at or below 138 percent of the Federal Poverty Level (FPL) starting January 1, 2014 (in 2016, this was $33,534 for a family of four and $16,394 for an individual). Since then, 30 states and the District of Columbia had expanded their Medicaid programs as of January 2016. Kansas has not expanded its Medicaid program.
Figures 3 and 4 present data on poor persons, defined as those below 100 percent of FPL (in 2016, this was $24,300 for a family of four and $11,880 for an individual). The data source used for this analysis could not be used to report only those below 138 percent FPL. Future analyses using additional data will allow us to report below 138 percent when appropriate.