

The Decennial Census is used to apportion seats in the U.S. House of Representatives, determine state legislative districts, and influence how billions of dollars in federal funding flow to states and communities. The Census also forms the basis for modeling other Census Bureau population estimates related to insurance coverage, race and ethnicity, age, income, and education – to name just a few! After initially extending the timeline for responses from July 31 to Oct. 31 in the wake of the COVID-19 pandemic, the Census Bureau recently announced that data collection will end on Sept. 30.
Sign up here to receive these summaries and more, and also follow KHI on Facebook, Twitter and LinkedIn. Previous editions of A Kansas Twist can be found on our ARCHIVE PAGE.
The good news for Kansas is that, as of Aug. 31, 2020, 92.1 percent of households had been enumerated either by self-response (68.7 percent) or nonresponse follow-up (NRFU, 23.4 percent). That placed Kansas fourth – behind only Idaho, West Virginia and Washington – in enumeration progress, well above the national rate of 83.2 percent.
A deeper dive into the self-response rate by Kansas county, though, tells a story of differences (Figure 1).
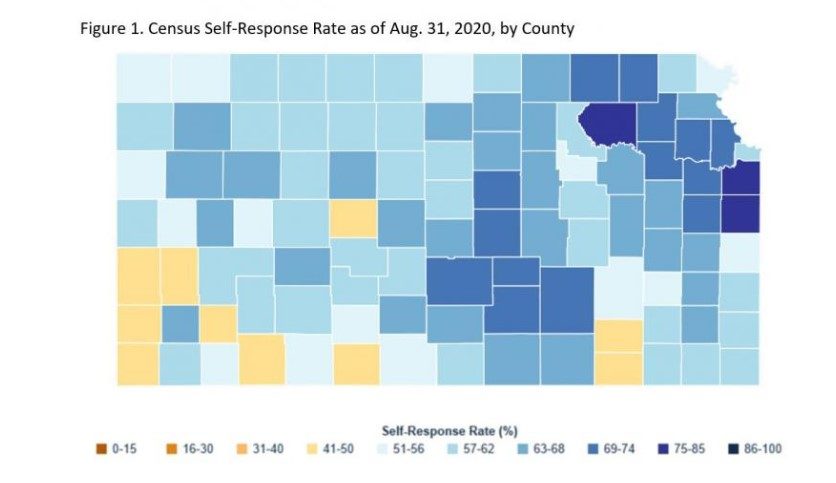
Note: The statewide self-response rate was 68.7 percent as of Aug. 31. The self-response rates shown for each county do not include responses captured by follow-up visits.
Source: U.S. Census Bureau, retrieved from https://2020census.gov/en/response-rates.html on Sept. 1, 2020. Click the link for an up-to-date, interactive map of each county.
The highest self-response rates in the state – 78.6 percent in Johnson County, 75.7 percent in Miami County, and 75.3 percent in Pottawatomie County – were in northeast Kansas. Meanwhile, the self-response rates were much lower in southwest Kansas counties, as well as in some counties in the southeast part of the state. (The lowest self-response rate was 42.8 percent, in Kearny County in southwest Kansas.)
There can be many reasons for variation in self-response rates – including differences in rates of housing vacancies, Post Office boxes or undeliverable mail, as the denominator for the calculation of the rate includes all housing units – and the map does not include household responses that may have been captured by follow-up visits (that data is currently available only at the state level). The Census Bureau uses the self-response data to identify places of low-response to adjust its outreach strategies. Historically, self-response rates lag in communities with higher concentrations of people of color, primarily Black, Hispanic and American Indian/Native Americans.
Mail, phone and internet responses are all included in calculating the self-response rate, and in late May the Census Bureau said the use of the internet in responding had outpaced its projections. But variations in internet responses among counties are even more extreme than for total self-response rates (Figure 2). Internet self-response rates represent the percentage of all housing units that responded to the Census via the internet.
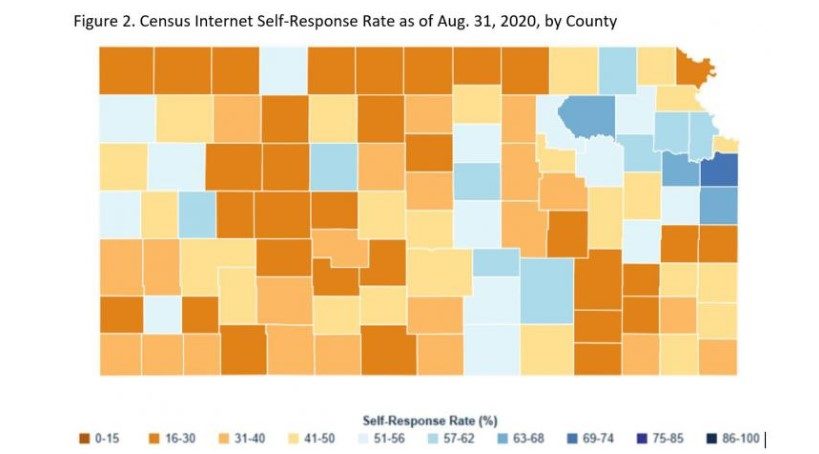
Note: The statewide internet self-response rate was 54.1 percent on Aug. 31. Internet self-response rates represent the percentage of all housing units that responded to the Census using the internet.
Source: U.S. Census Bureau, retrieved from https://2020census.gov/en/response-rates.html on Sept. 1, 2020. Click the link for an up-to-date, interactive map of each county.
Johnson County again led the way in Kansas, with an internet self-response rate of 72.0 percent. Many counties in other areas of the state – largely in rural western, northcentral and southeast Kansas – had internet response rates of under 30 percent (the lowest, 17.2 percent, was in Greenwood County in southeast Kansas).
Will wide variations in access to broadband service across the state, coupled with differences in adoption of internet use by age, education and income level, have an effect on the final Census count in Kansas? Will the areas of the state with less access to or use of the internet be fully counted?
At a minimum, the differences mean a full and accurate count will require more door-knocking in communities where self-responses lag. However, because of COVID-19, the Census Bureau delayed the start of nonresponse follow up (NRFU) described above. Combined with the recently announced Sept. 30 end to data collection, the timeframe of NRFU will be shortened by four weeks. (A coalition of civil rights organizations, cities and counties has sued to attempt to force the Administration to return to the previous date to which data collection had been extended, Oct. 31.)
There is still time for Kansans to respond to the Census, and it is possible that continued outreach and follow up will close the response rate gap. But the clock is ticking, and the results will have an effect on the next 10 years of policymaking, resource allocation and many aspects of life in Kansas communities.